Even More Control Over Visualizing Reports With Sales Data
Connect inSitu Sales To Looker Studio
Our enhanced sales analytics software now offers users the opportunity to connect to Looker Studio (formerly Google Data Studio) for customized data visualization.
Our connector provides users with two new features essential to benchmarking and improving sales team performance:
1. Customize reports with a powerful business intelligence tool.
2. Schedule reports to be sent by email.

How To Get Started
You can also login with our demo data if you don’t have an applicable account to use.
user: s1@insitumobile.com
pwd: trial
1
Set Up A Google Account
Google Data Studios requires an existing Google account (Gmail).
2
Connect Data Sources
Click on the “Data Sources” tab, then on “Add data source.” Select the “inSitu Sales For Looker” data source, then follow the steps to grant Google Data Studio access.
3
Create A Report
Click on the “Create” button and select “Report.” You can use a template or start with a blank report. You can also import a report from a Google Sheets file or an existing Google Data Studio report.
4
Add Charts & Tables
Using the imported data, click on “Add a chart,” select the type you want, and customize it using the options in the right-side panel.
5
Customize The Report
Personalize your data by adding images and text, changing the color scheme, or with interactive elements such as filters, drop-downs, and calculated fields.
6
Share & Publish, Or Schedule
When complete, you can use the “Share” button to send direct links, publish it for open accessibility, or schedule it for email delivery at your choosing.

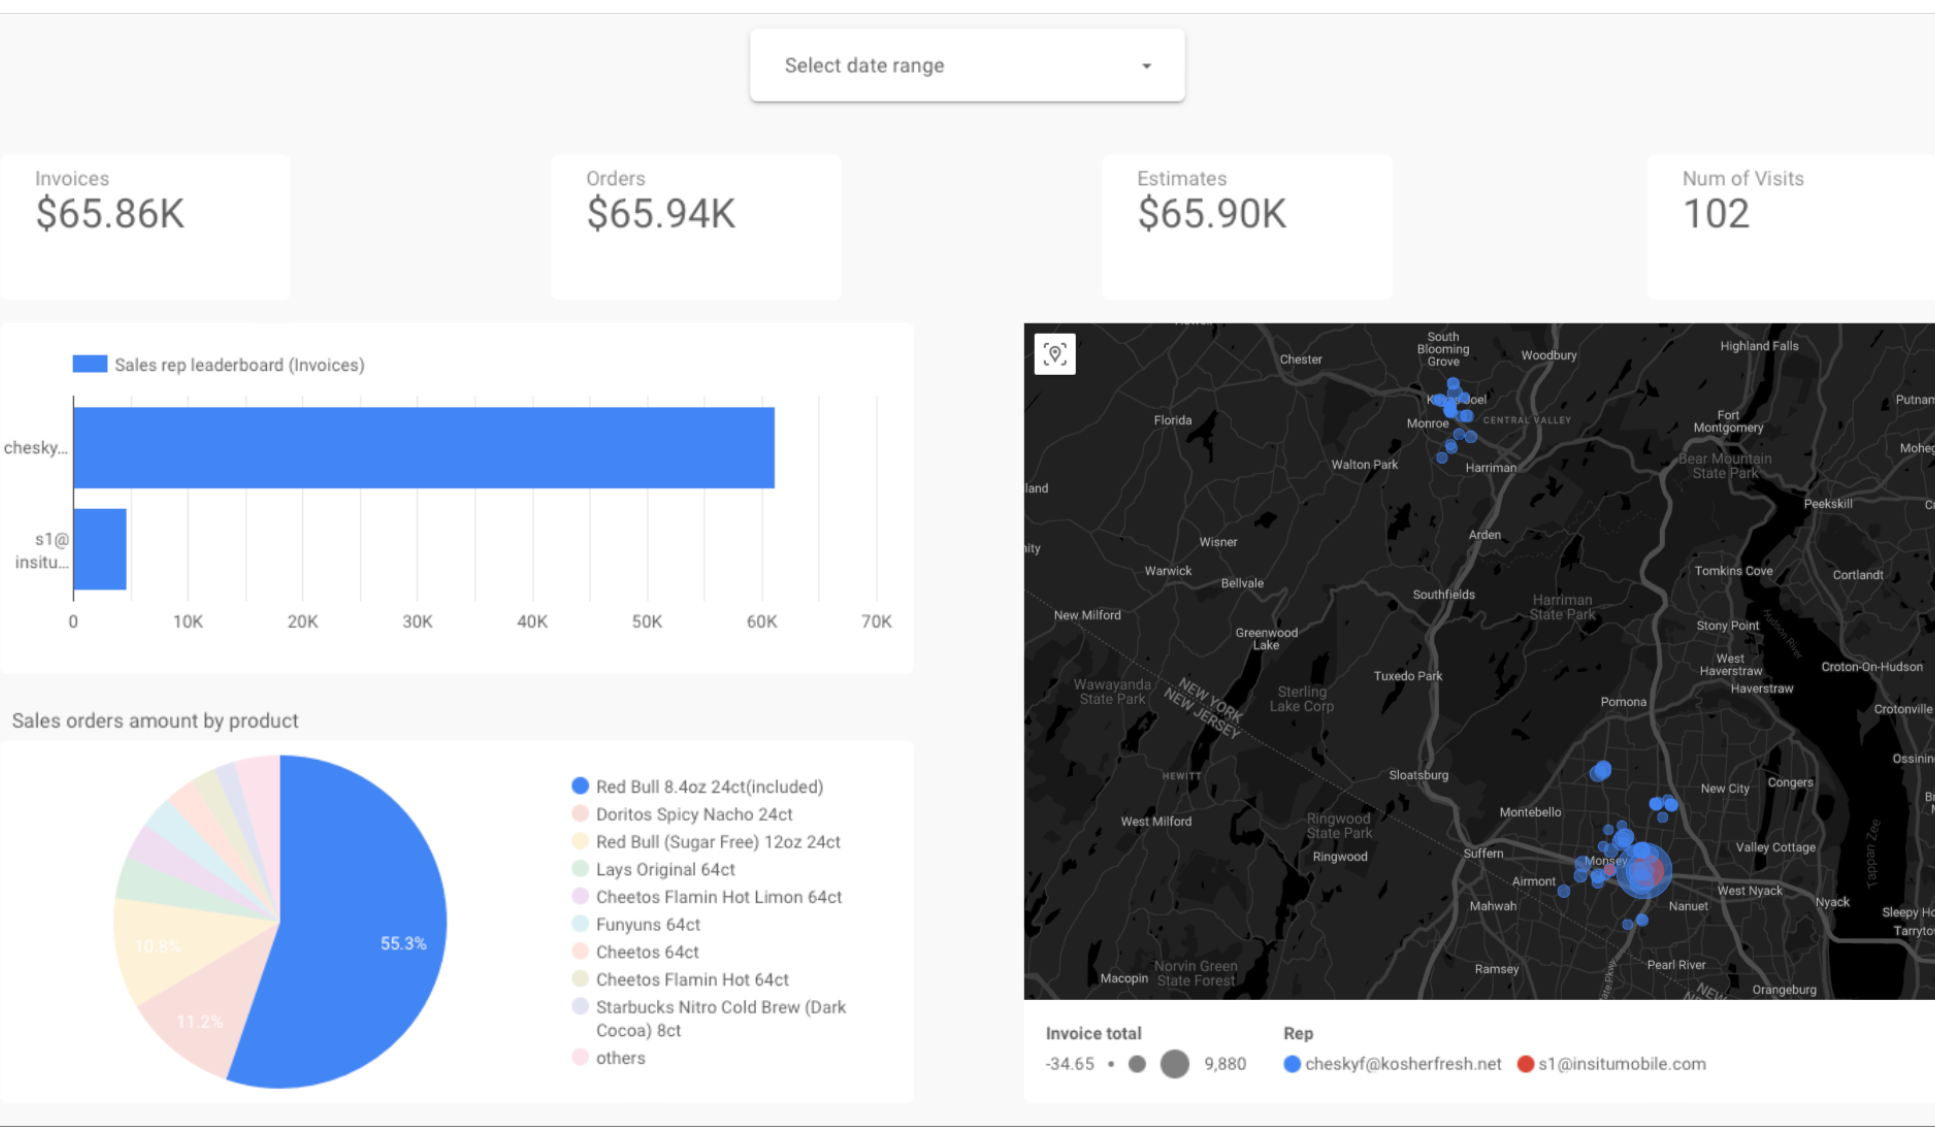
Create Detailed Reports Instantly
View data concerning customers, orders, or reps. Our connector lets you build a complete overview to visualize any source of data your team is interested in monitoring.