Data visualization for QUICKBOOKS®, SAP B1, Odoo, epicor & XERO
Sales Analytics For Wholesale Distribution
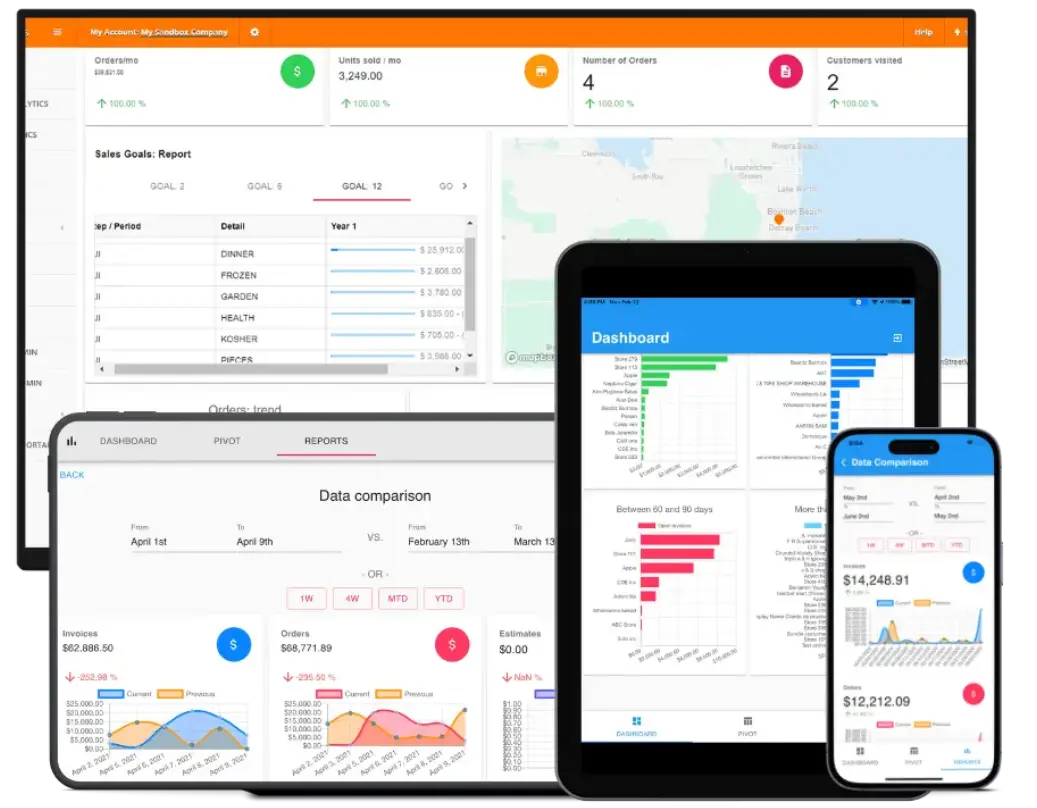
Monitor your field sales and delivery operations in real time with our sales analytics software.
Access amazing data visualizations designed for sales data captured from our accompanying sales app. All in real-time with full API access.
We can answer your questions.
PIVOT TABLES
Integrate With Field App For Actionable Sales Data
Cross variables, generate charts, review heatmaps, and go deep in analyzing your sales data. Xero, SAP, and QuickBooks reporting tools are built in. Our powerful field sales analytics can help you streamline your business.
Learn About The Sales App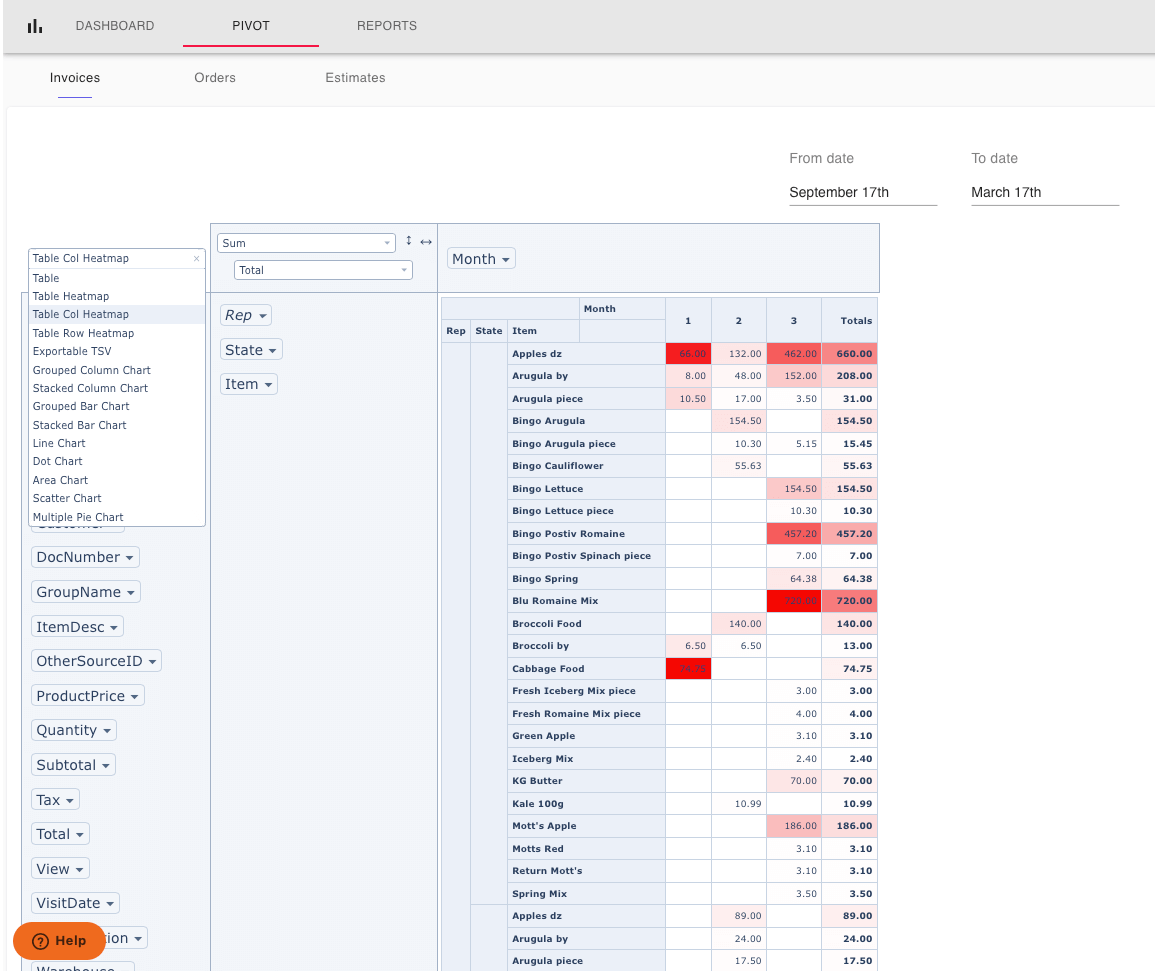
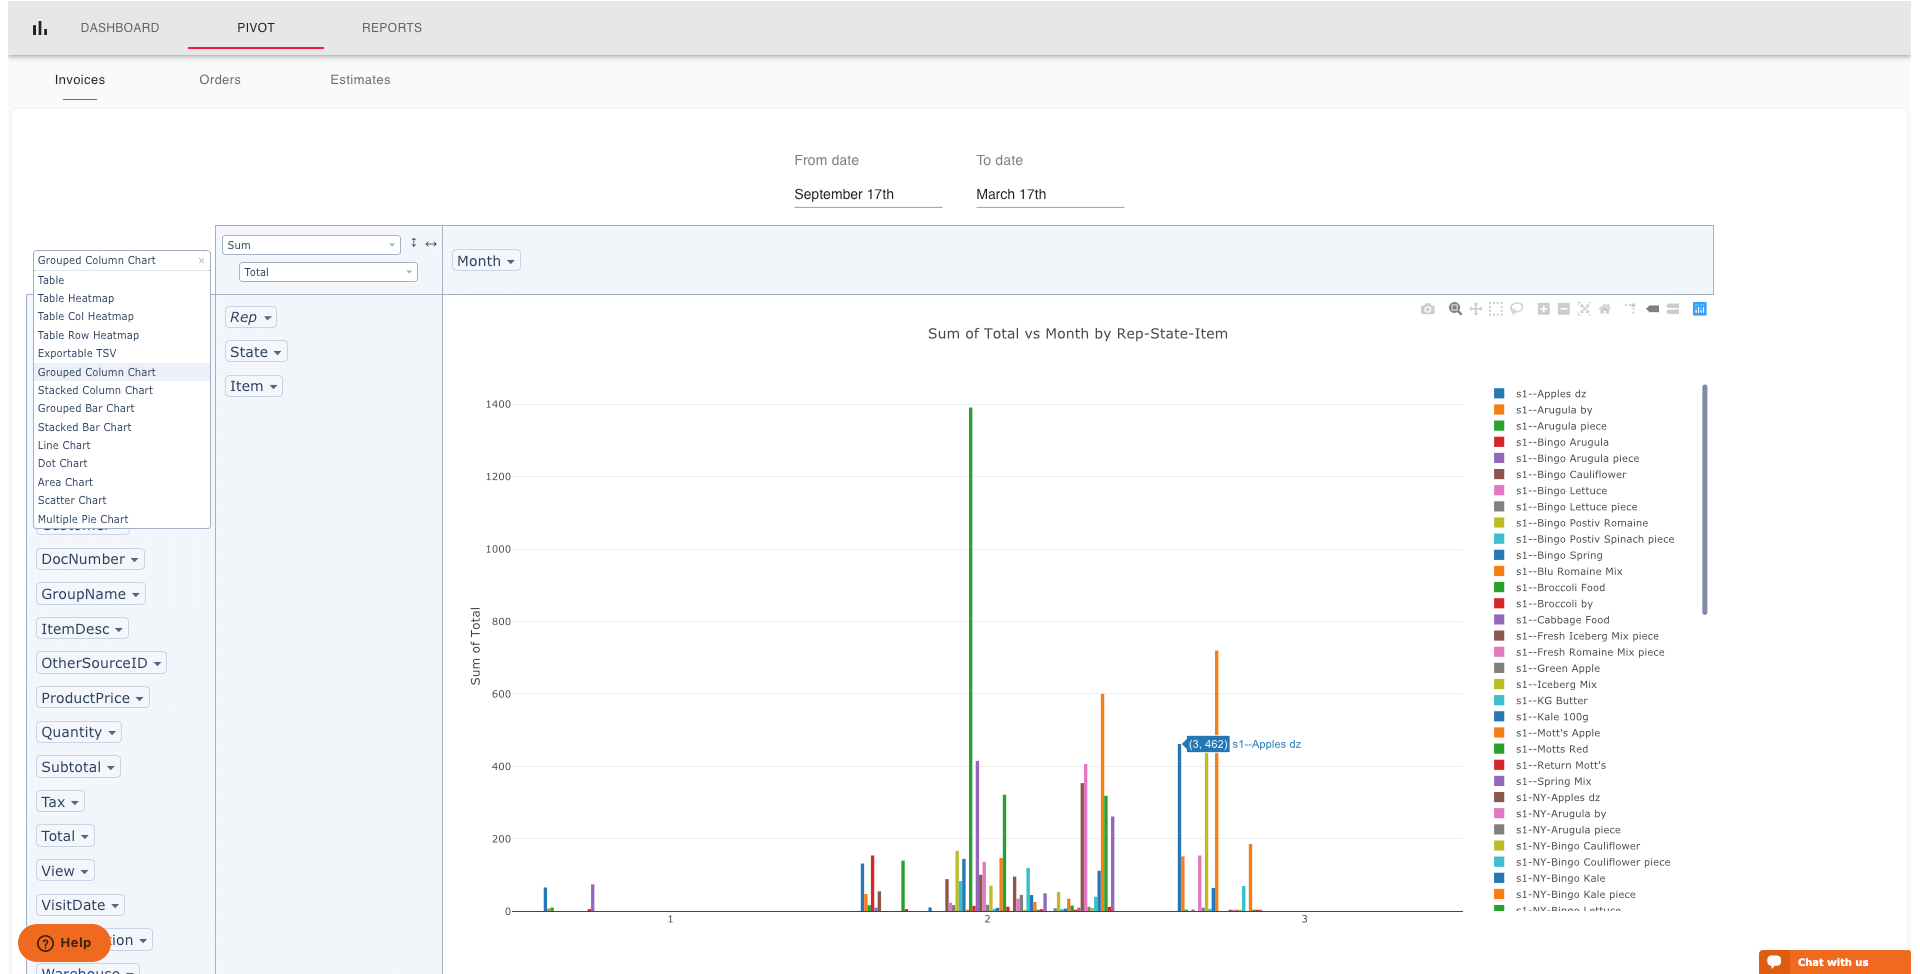
Pivot table
Group and filter data using any variable.
Try Sales by month grouped by Rep, State and Categories
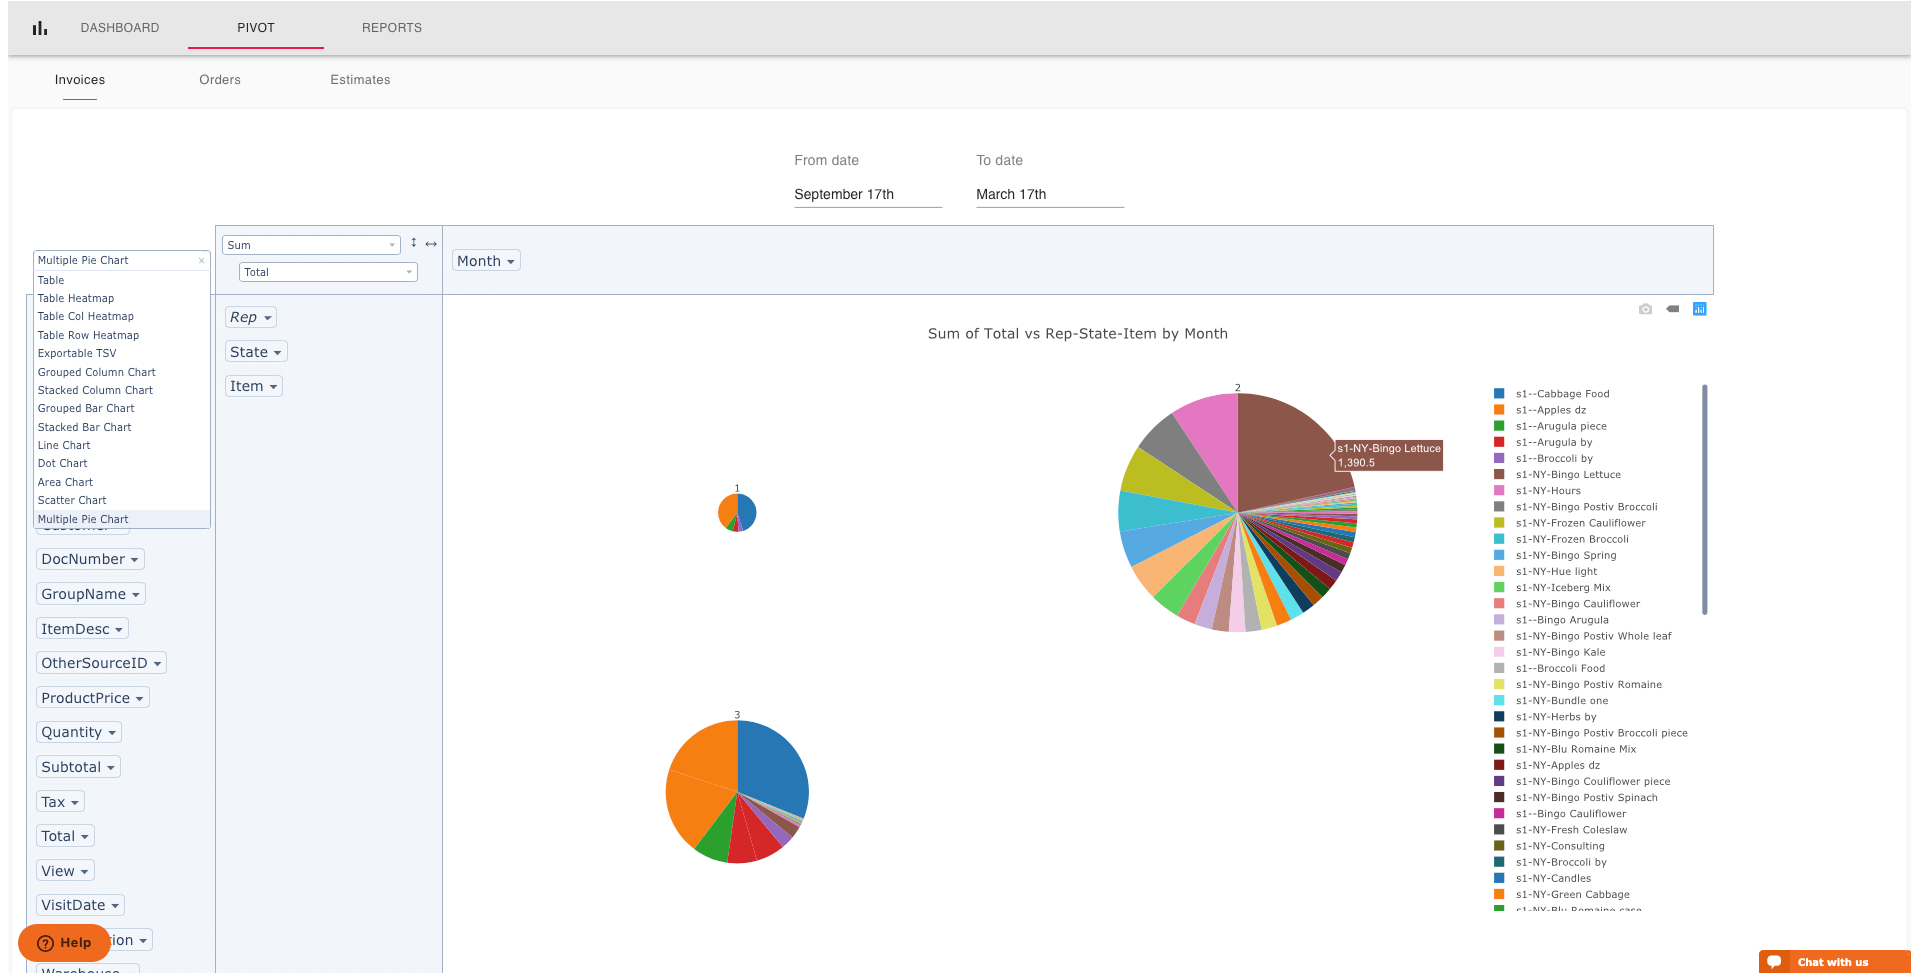
Build your own charts
Visualize your sales data in different formats, such as charts, tables, heatmaps, etc.
Get a fresh look at your data
Export data
Prefer another tool, or just want a closer look?
Export your data in a tab-separated file
REPORTS FOR YOUR SALES TEAM
Create And Export Powerful Sales Analytics Reports
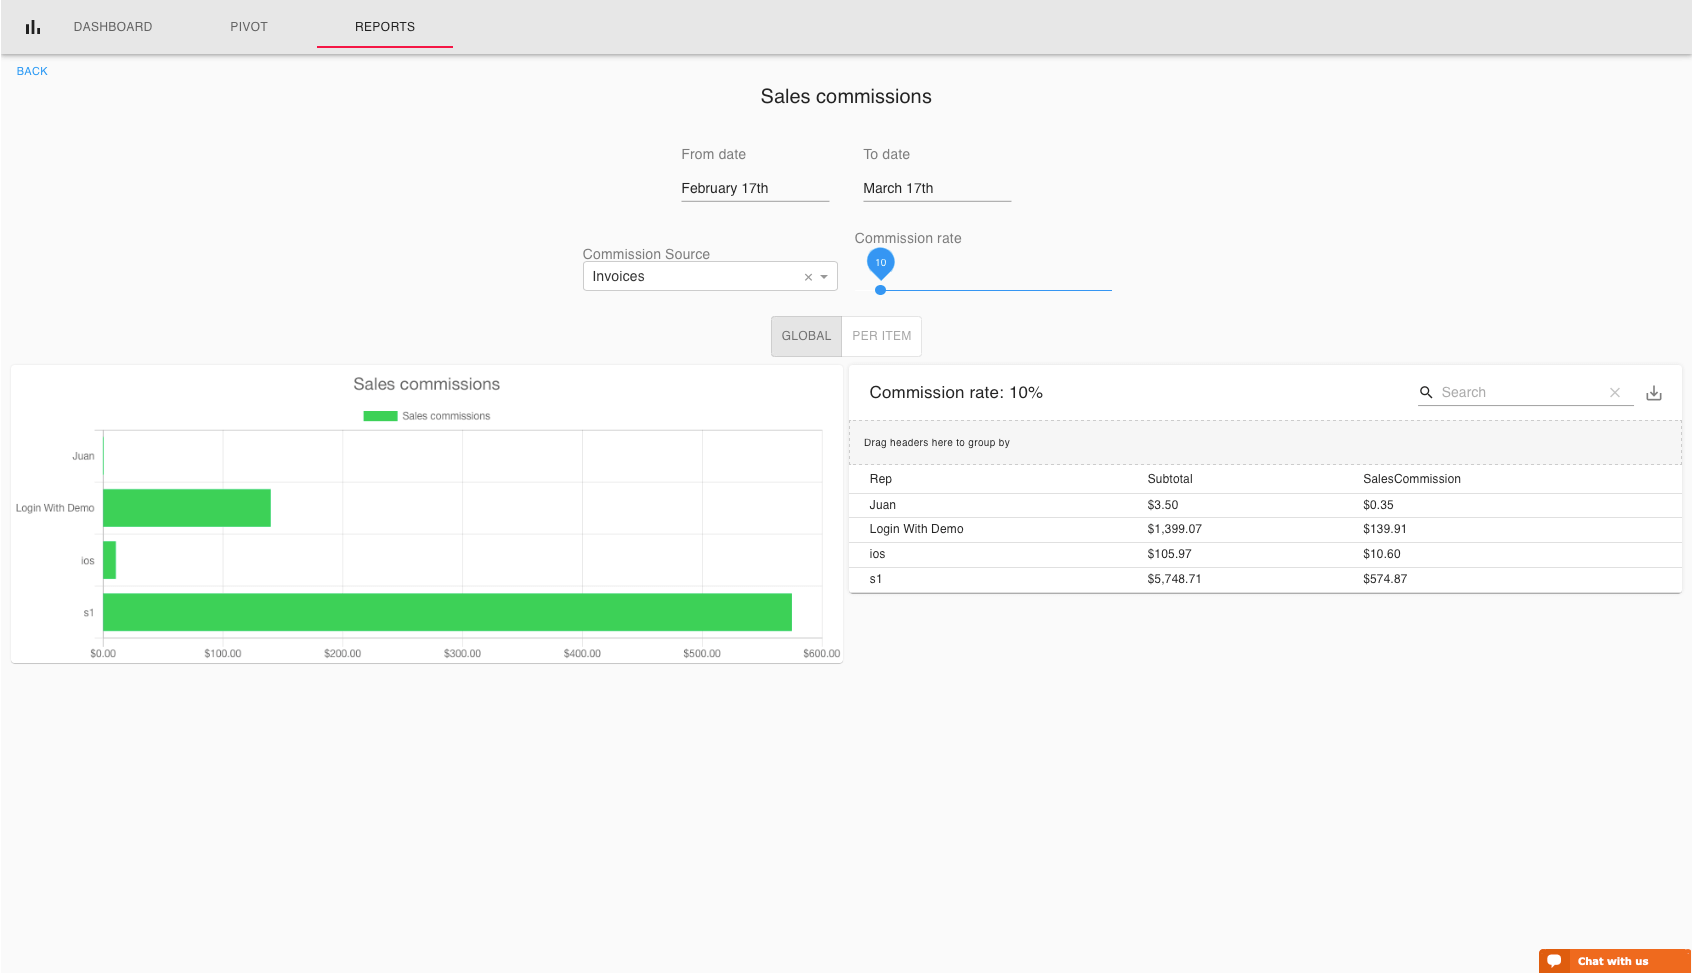
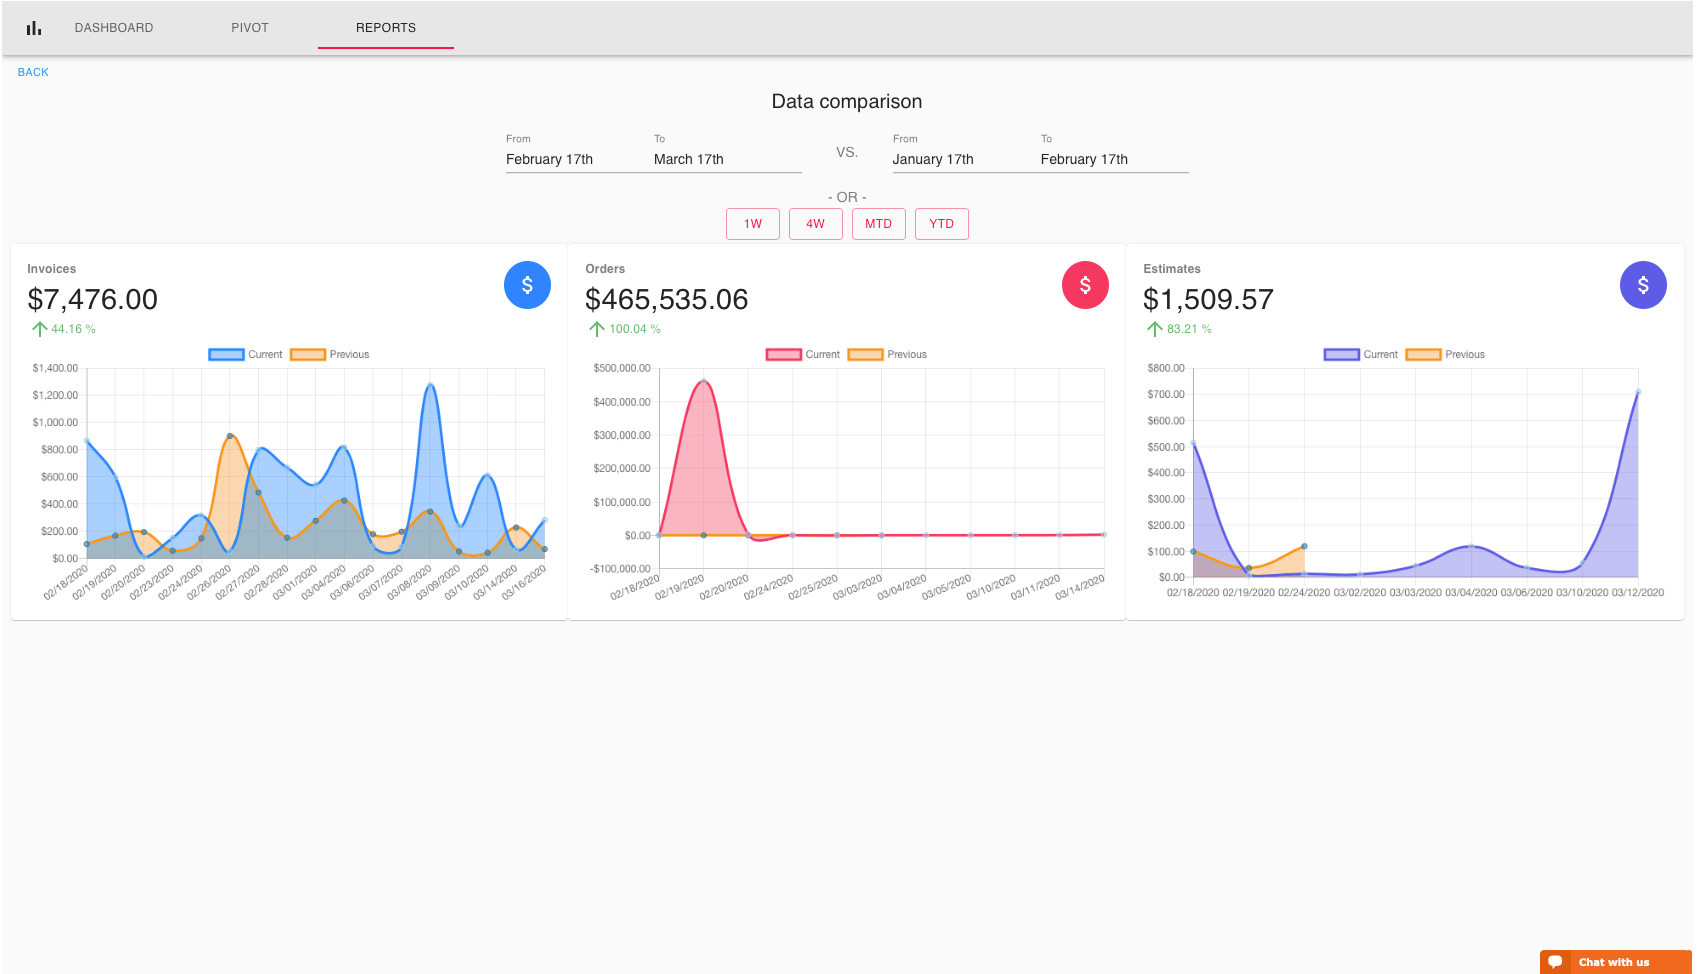
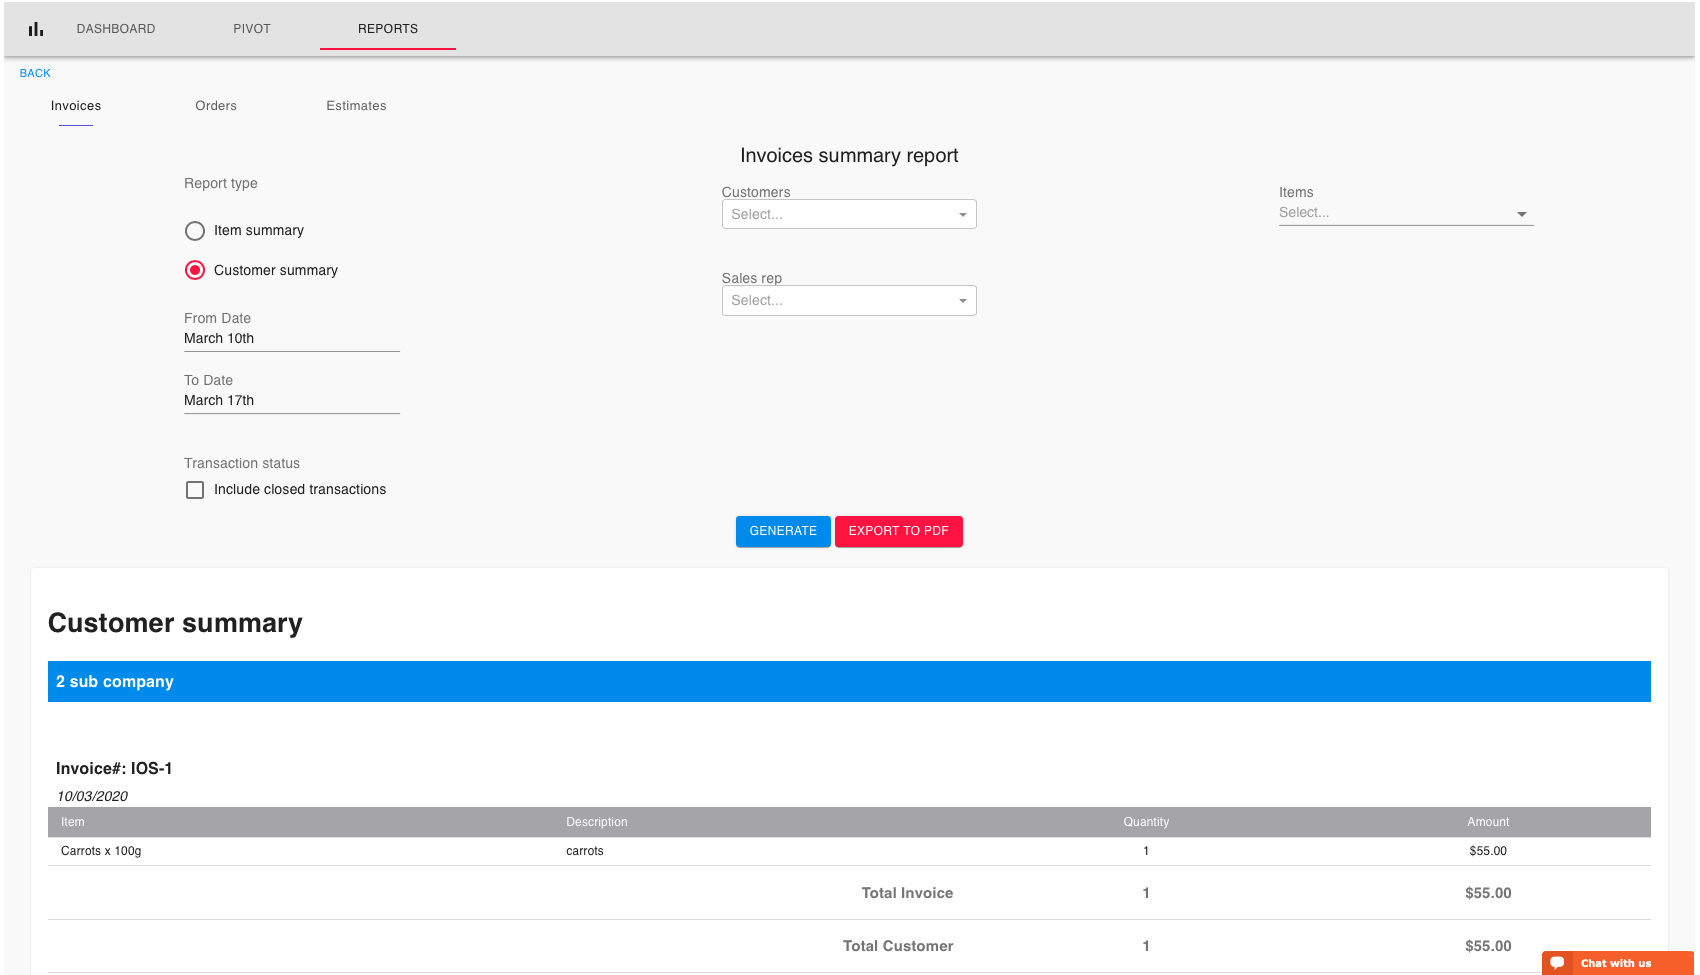
Review sales comparison by period, commissions, inventory, tracking and more. It’s simple to start, with the power to analyze your entire operation. Field sales analytics made easy.
EXPORT DETAILED DATA ON YOUR ROUTES
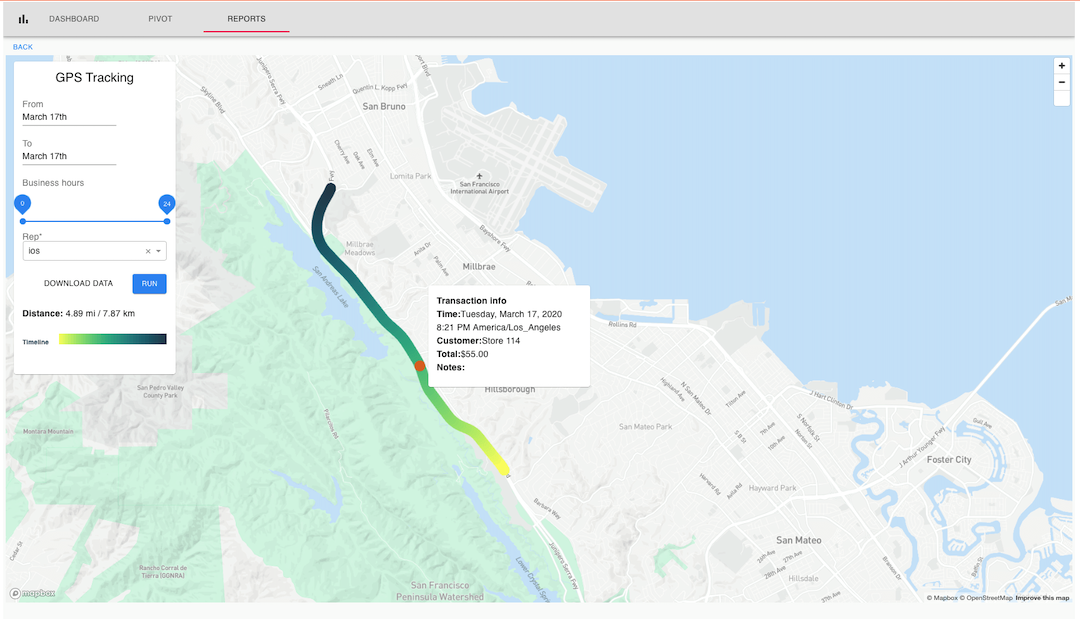
Enhanced Mobile GPS Tracking Reports
Generate reports for any date range. Find distance, visits and notes. Export data for further analysis or to deduct expenses. Our field sales management software makes everything simple – Manage your truck and DSD sales routes all in one place!
More Info On Route Accounting
